
Dynamic Power BI Dashboard Suite
Dynamic Power BI Dashboard Suite
In a data-driven world, the ability to visualize, analyze, and act on critical business insights is a game-changer. Our Power BI Dashboard Suite provides an intuitive, ready-to-use platform that transforms raw data into actionable insights through stunning, interactive visualizations. Designed for simplicity, scalability, and impact, our dashboards cater to diverse business functions like HR, Finance, Projects, Timesheets, Attendance, and Asset Management.
By uploading your data in a standard Excel format, you can seamlessly generate professional-grade dashboards without the need for advanced technical skills. Unlock your business’s potential with data-driven decision-making today.
Our Dashboard Suite: A Comprehensive Overview
HR Dashboard: Empowering Workforce Management
Our HR Dashboard provides a 360-degree view of your workforce to help you make informed people-management decisions.
Key Features:
- Employee Demographics: Visualize gender, age, department, and location distributions.
- Performance Metrics: Analyze KPIs like productivity scores, goals achieved, and peer reviews.
- Turnover and Retention: Track attrition trends and identify retention opportunities.
- Leave Management: Monitor employee leave balances, trends, and requests.
Financial Dashboard: Monitor and Optimize Your Financial Health
Stay in control of your organization’s financial performance with detailed, real-time insights.
Key Features:
- Revenue Analysis: Track income streams across departments, geographies, or products.
- Expense Monitoring: Categorize and monitor spending patterns to identify cost-saving opportunities.
- Profitability Metrics: Calculate gross profit margins, net income, and ROI.
- Cash Flow Trends: Ensure liquidity and predict future cash requirements
Projects Dashboard: Drive Project Success
Manage all aspects of your projects effectively, from planning to execution and closure.
Key Features:
- Budget vs. Actuals: Compare planned budgets against real-time expenses.
- Timeline Tracking: Visualize milestones, deadlines, and delays.
- Resource Utilization: Evaluate workloads and optimize team assignments.
- Risk Assessment: Identify bottlenecks and mitigate project risks early.
Timesheet Dashboard: Enhance Productivity Monitoring
Analyze work hours, task allocations, and productivity levels with our timesheet solution.
Key Features:
- Time Tracking: Monitor employee hours logged on specific tasks or projects.
- Productivity Insights: Identify inefficiencies and optimize work allocation.
- Billable vs. Non-Billable Hours: Measure profitability by tracking chargeable hours.
- Overtime Monitoring: Understand trends in overtime and ensure compliance.
Attendance Dashboard: Ensure Workforce Efficiency
Gain real-time insights into attendance patterns, absenteeism, and workforce availability.
Key Features:
- Daily Attendance Trends: Visualize attendance rates across teams and shifts.
- Absenteeism Analysis: Identify patterns and take corrective action.
- Punctuality Insights: Monitor late arrivals and early departures.
- Compliance Monitoring: Ensure adherence to attendance policies.
Asset Overview Dashboard: Optimize Asset Utilization
Track and manage your organization’s assets efficiently.
Key Features:
- Asset Inventory: Maintain an up-to-date record of all physical and digital assets.
- Utilization Metrics: Measure how effectively assets are being used.
- Maintenance Schedules: Plan preventive maintenance to reduce downtime.
- Depreciation Analysis: Track asset value over time for financial accuracy.
How Our Solution Works
Step 1: Data Preparation
- Simply structure your data in Excel using our ready-made templates for each dashboard type.
- The templates guide you in formatting your data for seamless integration into our Power BI system.
Step 2: Data Upload
- Upload your Excel file through a secure interface.
- The system automatically processes your data, eliminating the need for manual intervention.
Step 3: Dynamic Dashboard Generation
- Watch your data transform into beautiful, interactive Power BI dashboards.
- Drill down into granular details, filter data by categories, and customize visuals on the fly.
Step 4: Insights at Your Fingertips
Use the dashboards to make data-driven decisions, optimize processes, and track performance metrics effortlessly.
Core Features That Set Us Apart
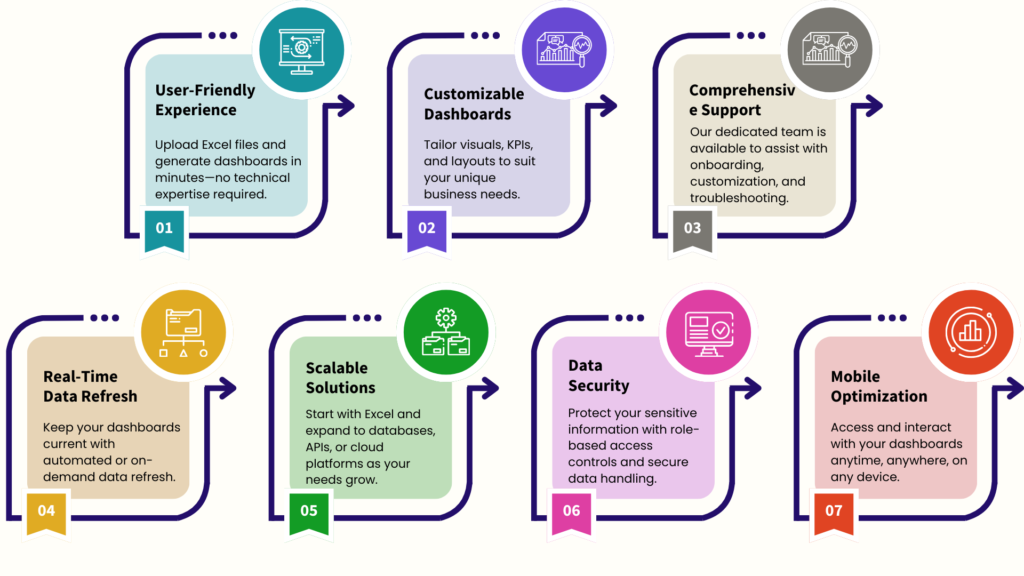
Why Choose Our Power BI Dashboard Suite?
For Businesses
- Make faster, smarter decisions with actionable insights.
- Save time by automating data processing and reporting.
- Reduce dependency on IT teams for routine analytics tasks.
For Teams
- Align efforts with clear, transparent metrics.
- Improve productivity with insights into workflows and outcomes.
- Identify and mitigate risks before they escalate.
For Individuals
- Simplify complex data into easy-to-understand visuals.
- Gain recognition for making data-backed recommendations.
Getting Started is Easy
Step 1: Download our Excel templates to format your data quickly and accurately.
Step 2: Upload your data to generate dashboards instantly.
Step 3: Explore, interact, and customize dashboards to extract meaningful insights.
FAQs
- Can I integrate other data sources besides Excel?
Yes! Our solution supports integration with databases, APIs, and cloud storage platforms for more advanced use cases. - Do I need a Power BI license to use these dashboards?
Yes, a Power BI Pro or Premium license is required to access and interact with the dashboards. - Is my data secure?
Absolutely. We implement industry-standard encryption, role-based access controls, and data privacy measures to ensure your information is safe. - Can I customize the dashboards?
Yes, all dashboards are fully customizable. You can modify visuals, metrics, and layouts to fit your needs. - Is training or support available?
Yes, we offer comprehensive training and ongoing support to ensure you maximize the value of our solution.