
How to create DrillThrough in Power BI
Problem statement
- DrillThrough of Category and Region based on sales.
High-level resolution steps
- I have to drill down Sales by Category and Sales by Region using the Drill Through property.
Detailed resolution steps
Step 1:
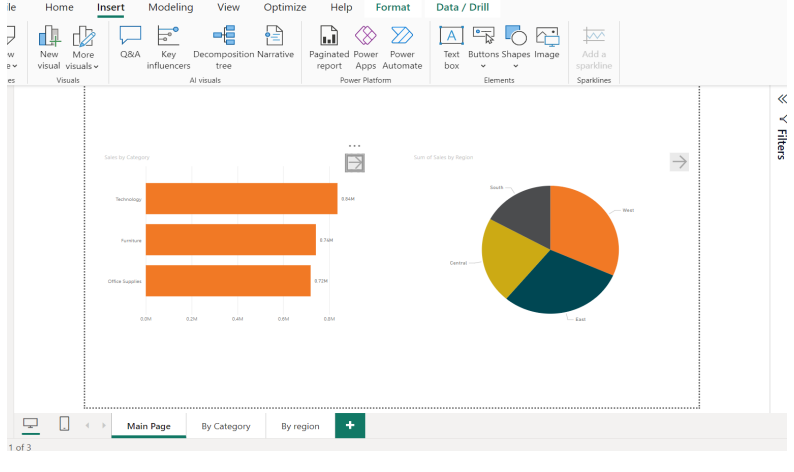
- In Power BI “MainPage,” I have two visual representations based on Category and Region.
- In First Visual, I used a Clustered Bar Chart and showed the Sales by Category. And in the second visual, I used a pie chart and showed Sales by Region.
- And to apply the drill-through select button, i.e., Insert >> Button >> Right Arrow.
Step 2:- Now add ByCategory sheet, in which I want to show sub-Category sales, year sales, and segment sales based on individual category using Drill Through. And in ByRegion sheet, I want to show customer name, sales, and city sales based on region.
ByCategory Sheet :-

ByRegion Sheet :

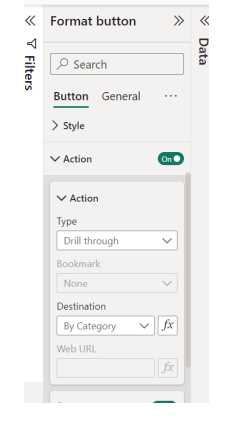
Step 3:– Now, in “Main Page”, add an action to both buttons. First, select the button and in the Format button pane, enable the Action option. After that, expand the Action option and select Type as Drill Through and Destination as ByCategory for the Sales by Category visual. For Sales by Region, change Destination to ByRegion.
Output:
Drill Through in PowerBI.webm